










A technical SEO workflow using Chrome DevTools and Search Console
When I audit a JavaScript page, I check whether its important content is available before a visitor clicks anything. A page can look complete in Chrome while its main copy, navigation links, product details or FAQ text is injected only after an interaction. Google can render JavaScript, but its crawlers generally do not click buttons or run functions that wait for a user action. That gap is easy to miss if I judge the page from its final screen alone. [3] [4]
I compare three versions of the page: the HTML response from the server, Chrome’s live DOM after JavaScript runs, and the HTML Google’s live inspection tool renders. Each answers a different question.
The 3 HTML states
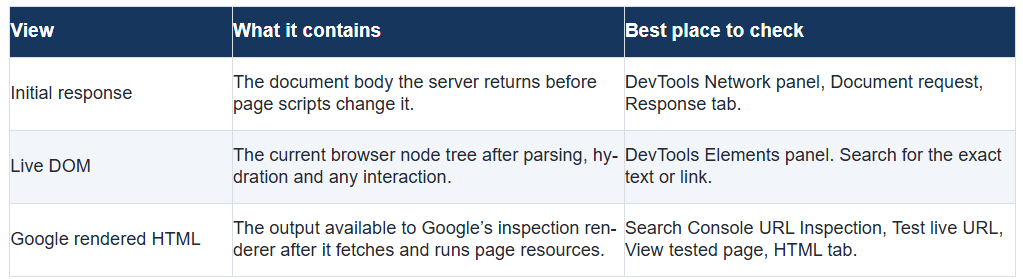
People often say “original DOM” when they mean the initial HTML response. Strictly, the DOM is the browser’s current tree, and JavaScript can change it. Chrome’s Elements panel shows that live tree; View Source and Network > Document > Response show the initial response. Google makes the same distinction in its rendered source guidance.
Start with the server response in Chrome
Open the page in Chrome and open DevTools by right-clicking the page and choosing Inspect. In Network, select the Document filter, reload the page, and open the main HTML request’s Response tab. This is the closest view of the document the server sent before client-side scripts modify the page.
Search that response for the page title, main heading, a sentence of important copy, the key navigation links, canonical and robots directives, and any structured data the page is meant to expose. Check whether important links are real <a href="…"> elements. A button with an onclick handler is not a crawlable link to the next URL.
A small app shell in the first response is a useful clue, but it does not prove Google cannot see the page. Google renders JavaScript and can index content that scripts add automatically. Continue to the live DOM and Google render before deciding there is a problem.
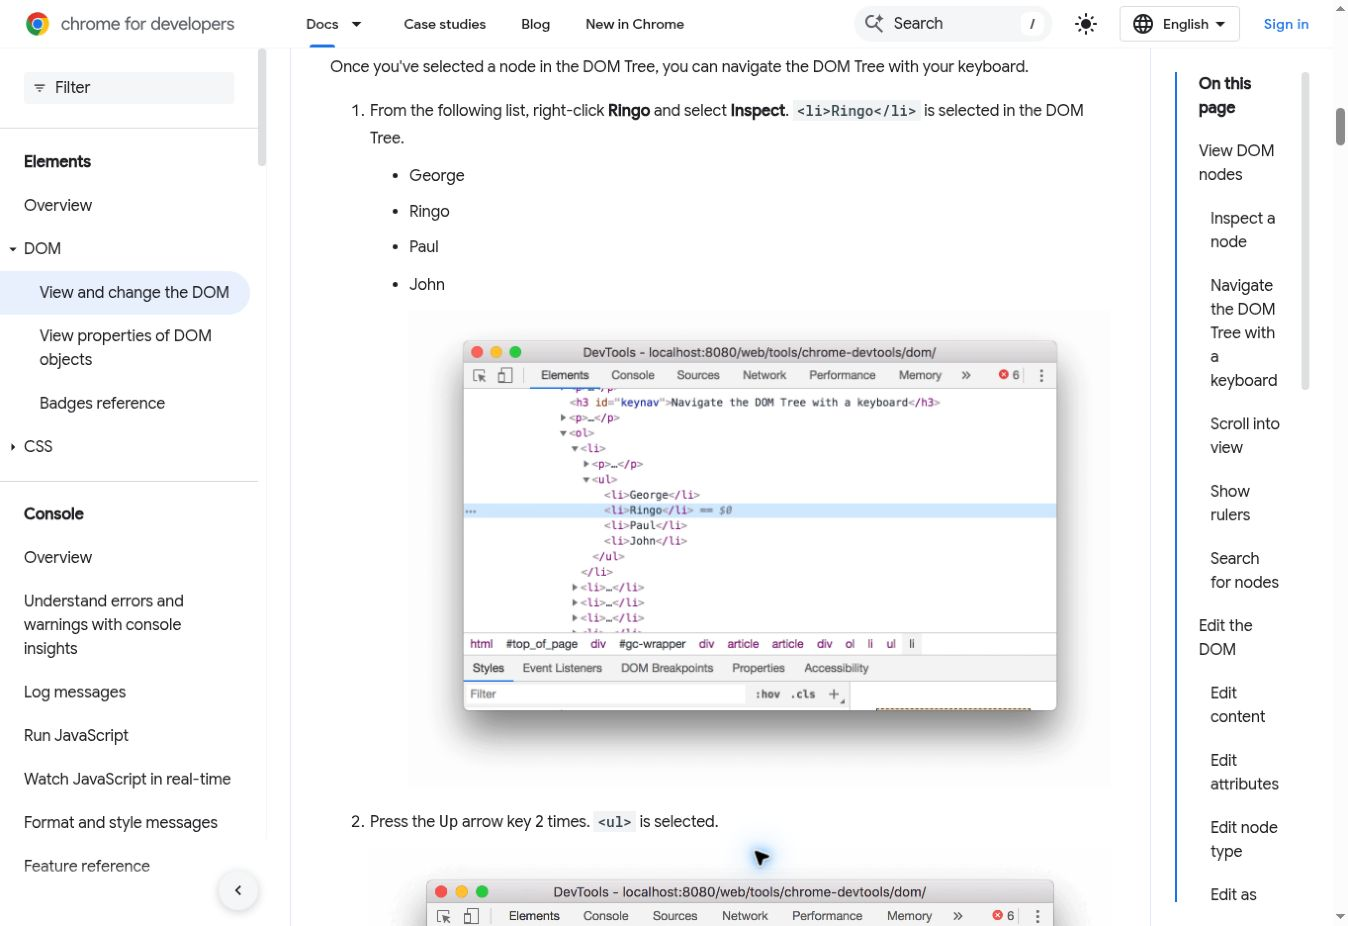
Figure 1. Chrome DevTools Elements panel with a DOM node selected. This Chrome for Developers image is a UI reference; the Elements panel shows the current DOM, not the original server response
Compare the live DOM before and after interaction
Once the page has finished loading, switch to Elements and search for the same text you checked in the response. If the text is absent from the response but present in Elements, JavaScript added it automatically. That can still work for Google when the required scripts and data load successfully. If the text is absent until you click a control, the page is relying on a user action to expose it.
The screenshots below use W3Schools’ public AJAX example. Before the click, the demo contains a placeholder and a Change Content button. After the click, the button’s script requests a text file and replaces the placeholder. That is the behaviour to look for on product tabs, “load more” controls, filters, review panels and other interactive elements.
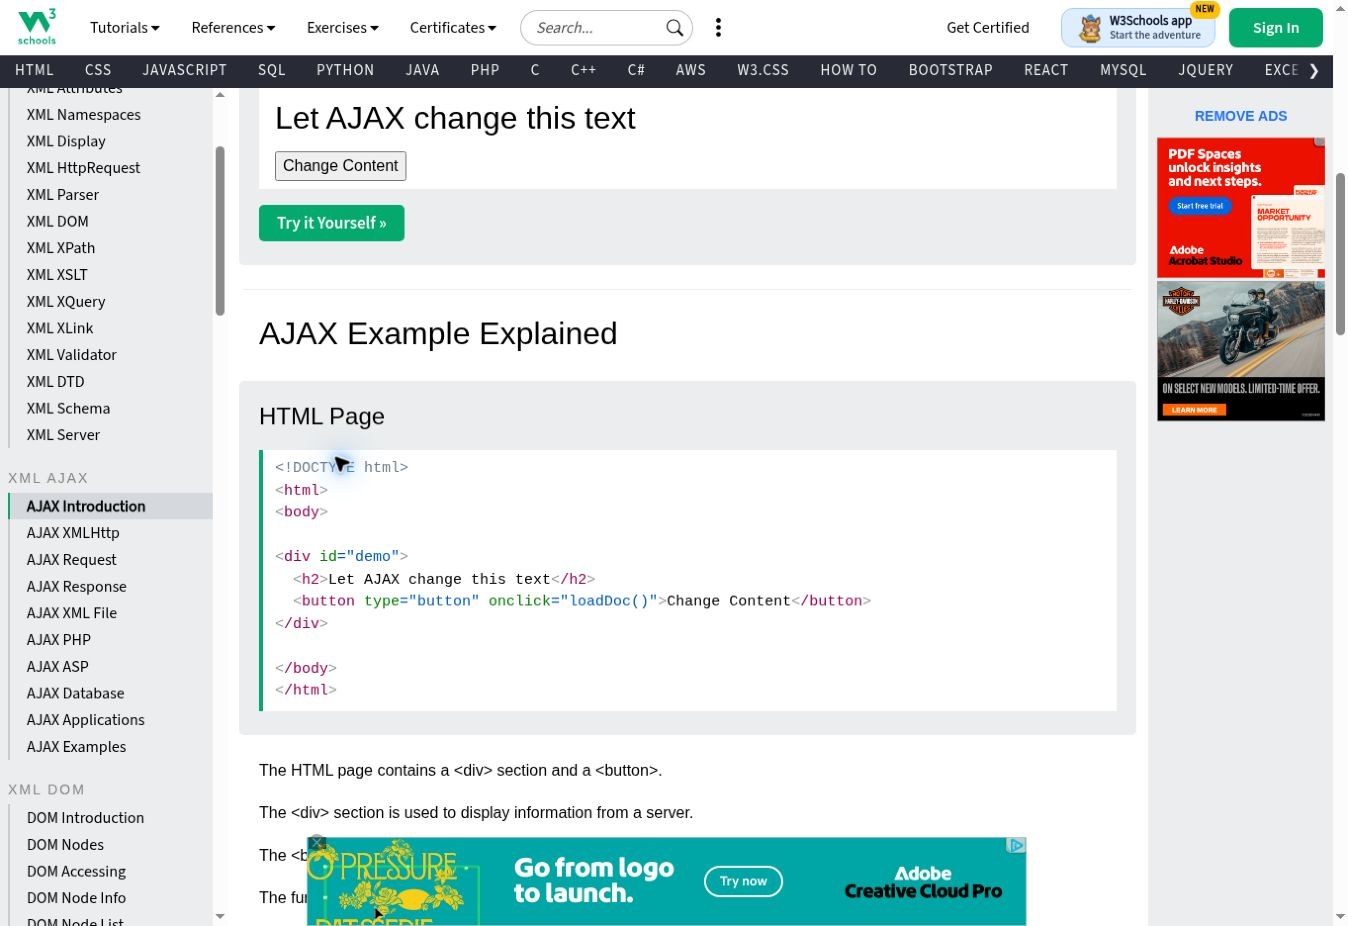
In DevTools, open Network > Fetch/XHR, clear the request list and click the control once. If a request appears only after the click, the content is being fetched on demand. Compare the response and the DOM again. This tells you whether the content is simply collapsed in the interface, inserted from data that was already present, or absent until the interaction triggers a request.
That distinction matters. An accordion can hide text visually while keeping it in the initial HTML. A tab can also switch between content already present in the DOM. Those cases are different from a button that makes a request and inserts the response after a click. The button itself is not the issue; the timing and availability of the content are.
Run the live URL test in Search Console
For a property you can access, enter the full page URL in Search Console’s URL Inspection tool. First read the indexed result and its last crawl information. Then click Test live URL. When the test finishes, open View tested page and review the HTML, Screenshot and More Info tabs. Google’s help documents this path and says the HTML tab shows the rendered HTML.
Login to search console, you can see the inspect option at the top >
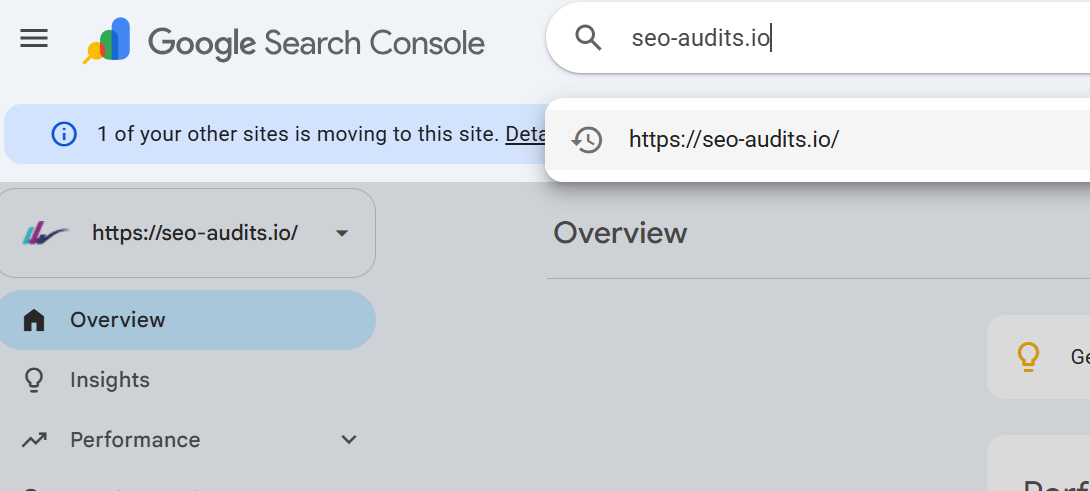
Paste in a URL and then click TEST LIVE URL >
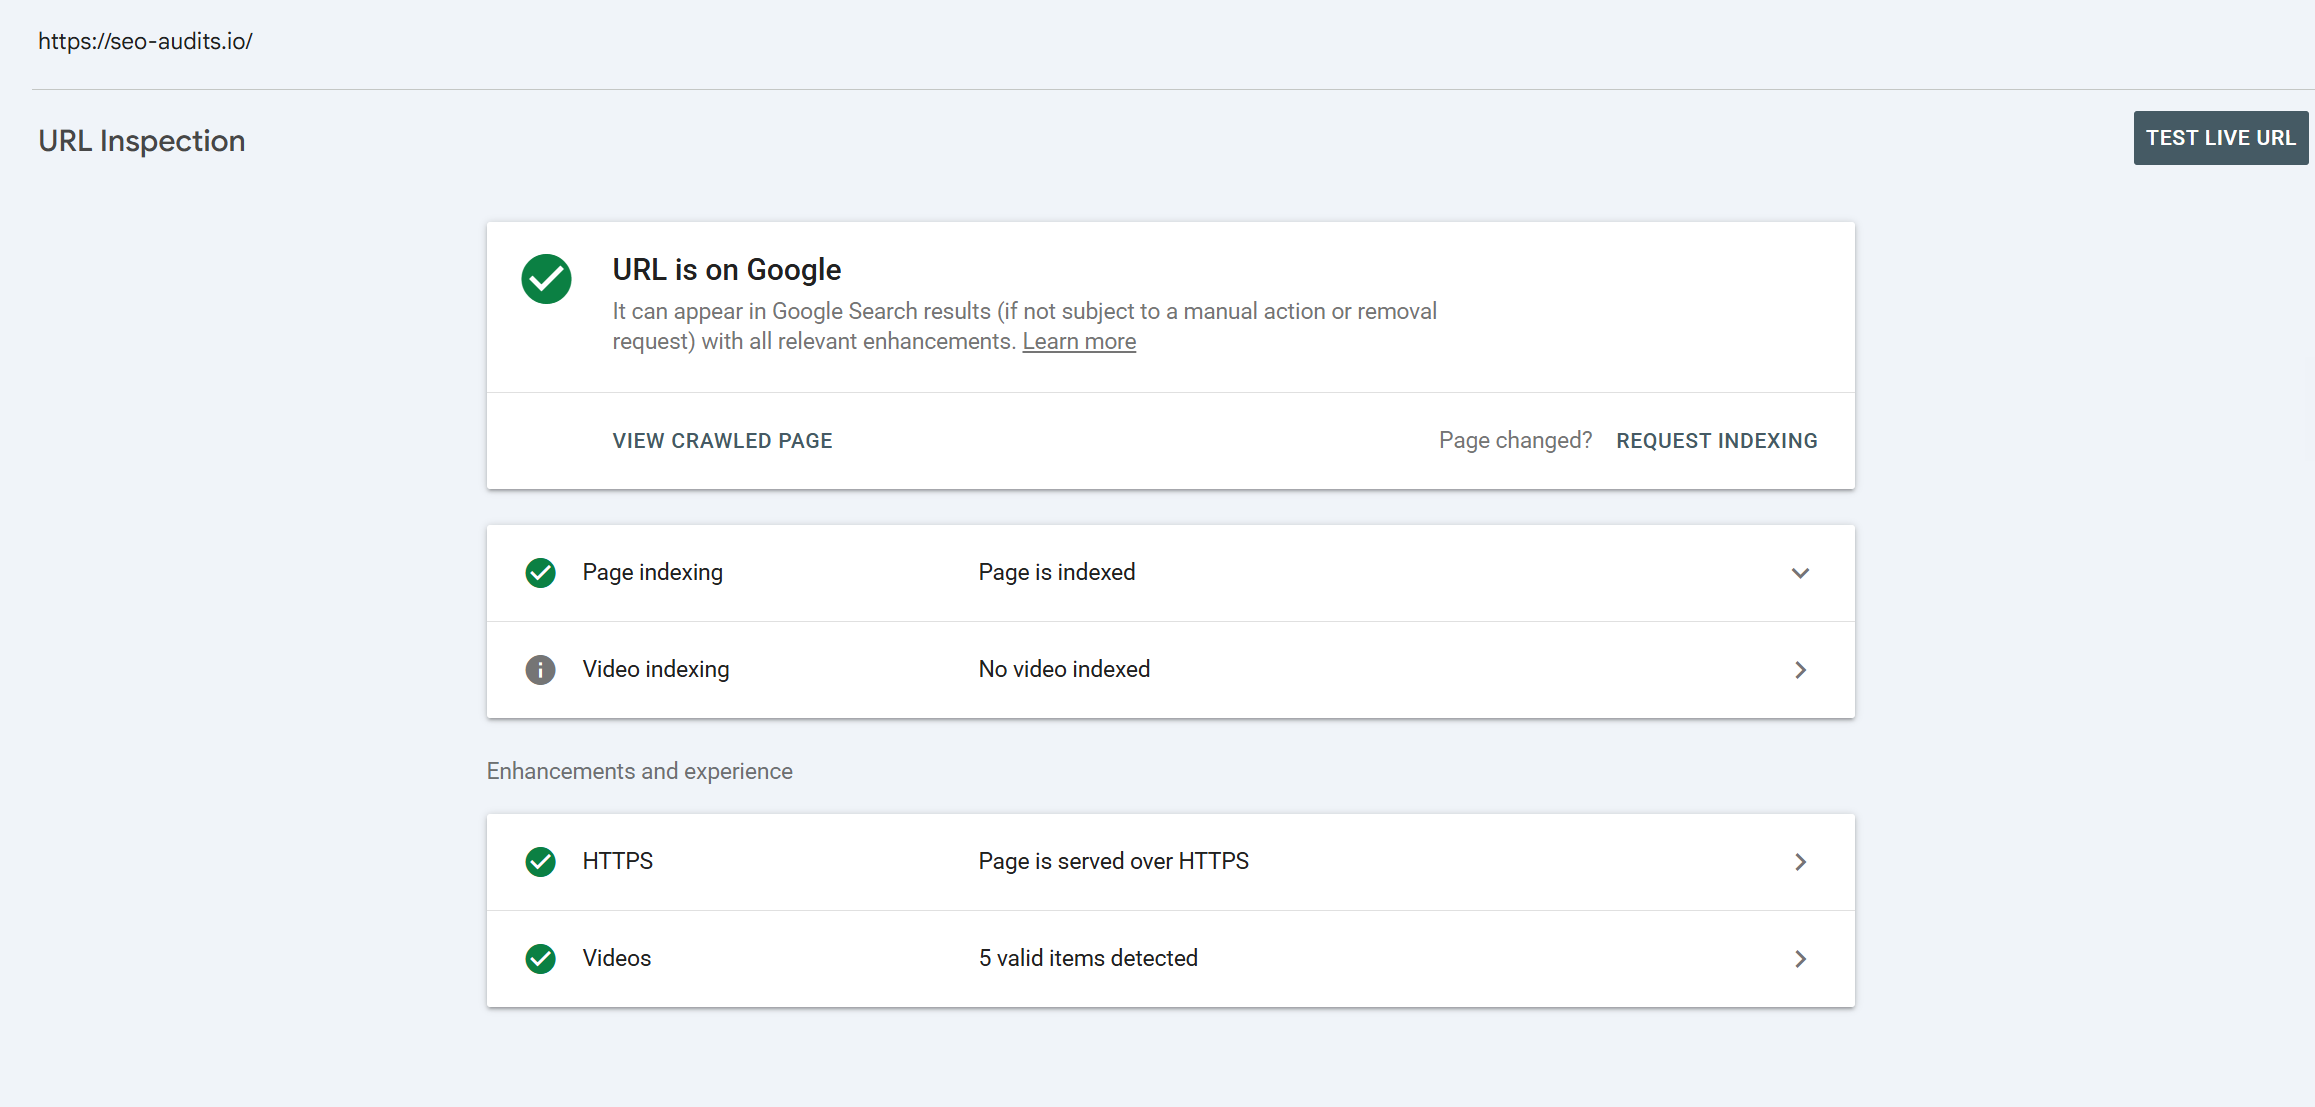
It will take a short while to run.
When that has ran, you will want to click VIEW TESTED PAGE, this is where it will open up the tested page data.
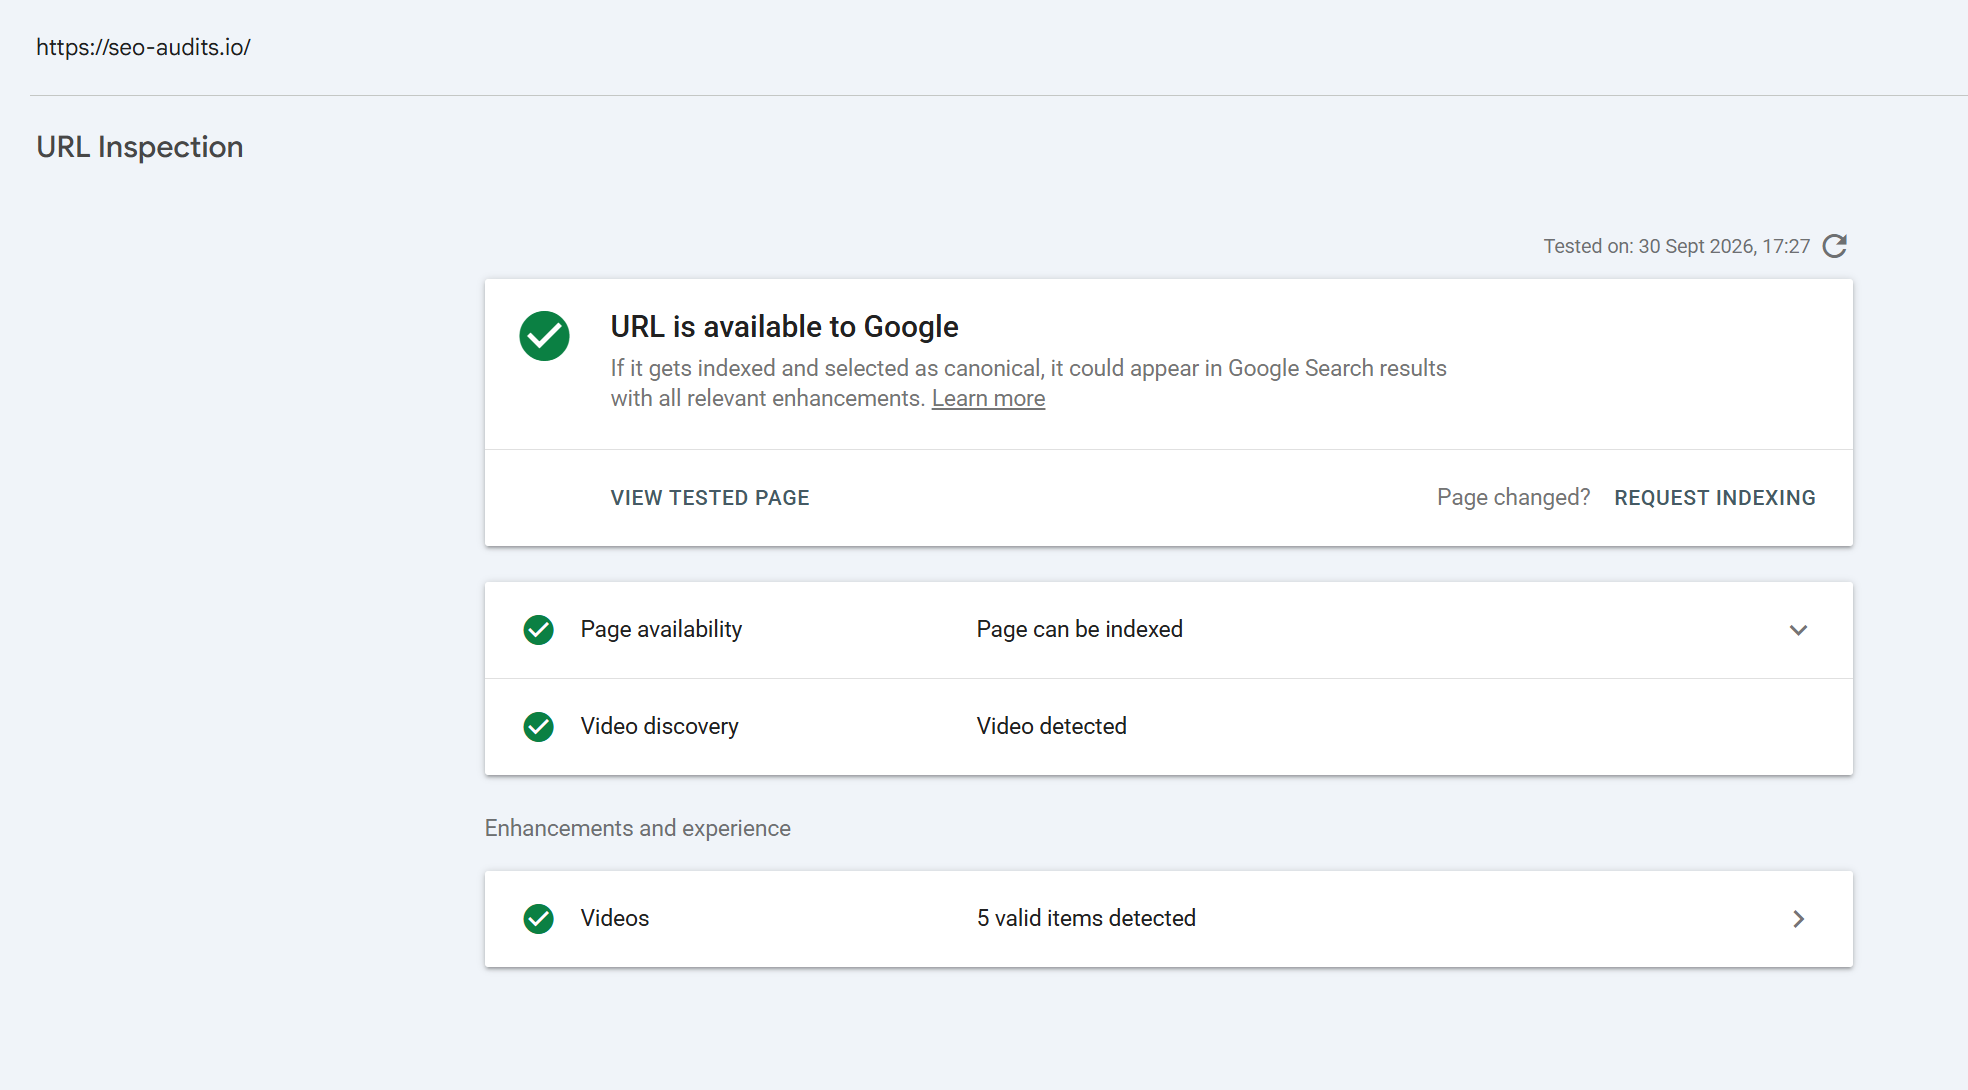
In the HTML tab, search for exact phrases from the heading, body copy, product details, FAQs and navigation. Search for the destination URLs of important internal links as well.
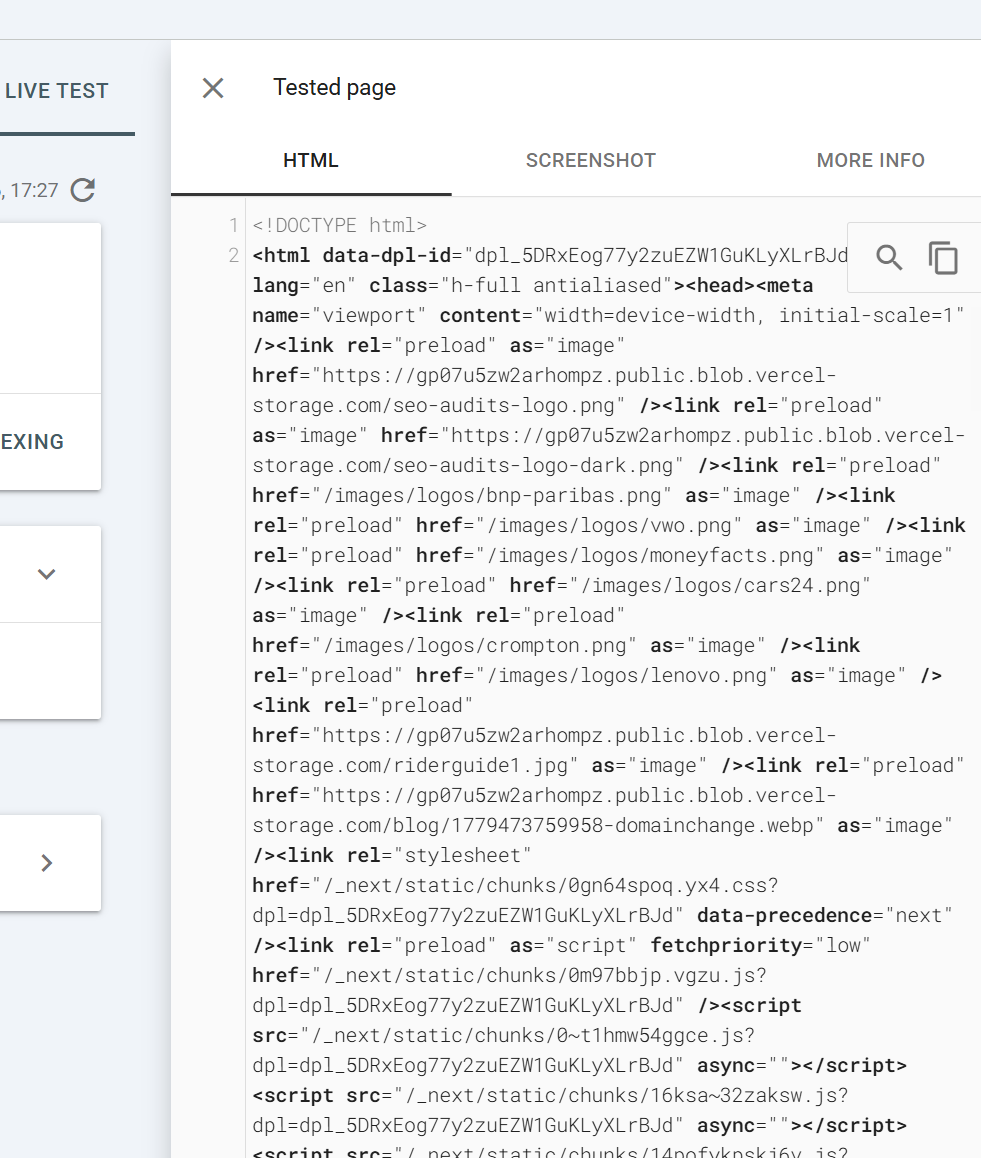
What I like to do is select the COPY function so I can get the full output
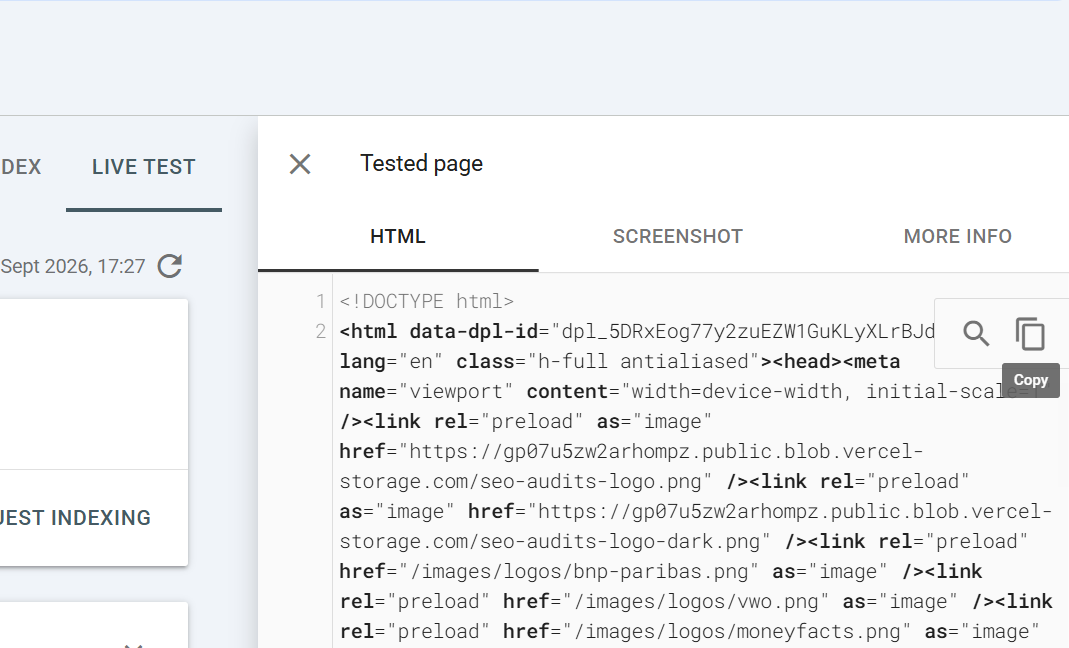
What I then do is paste the HTML output into a notepad and save it as Google Rendered code.txt
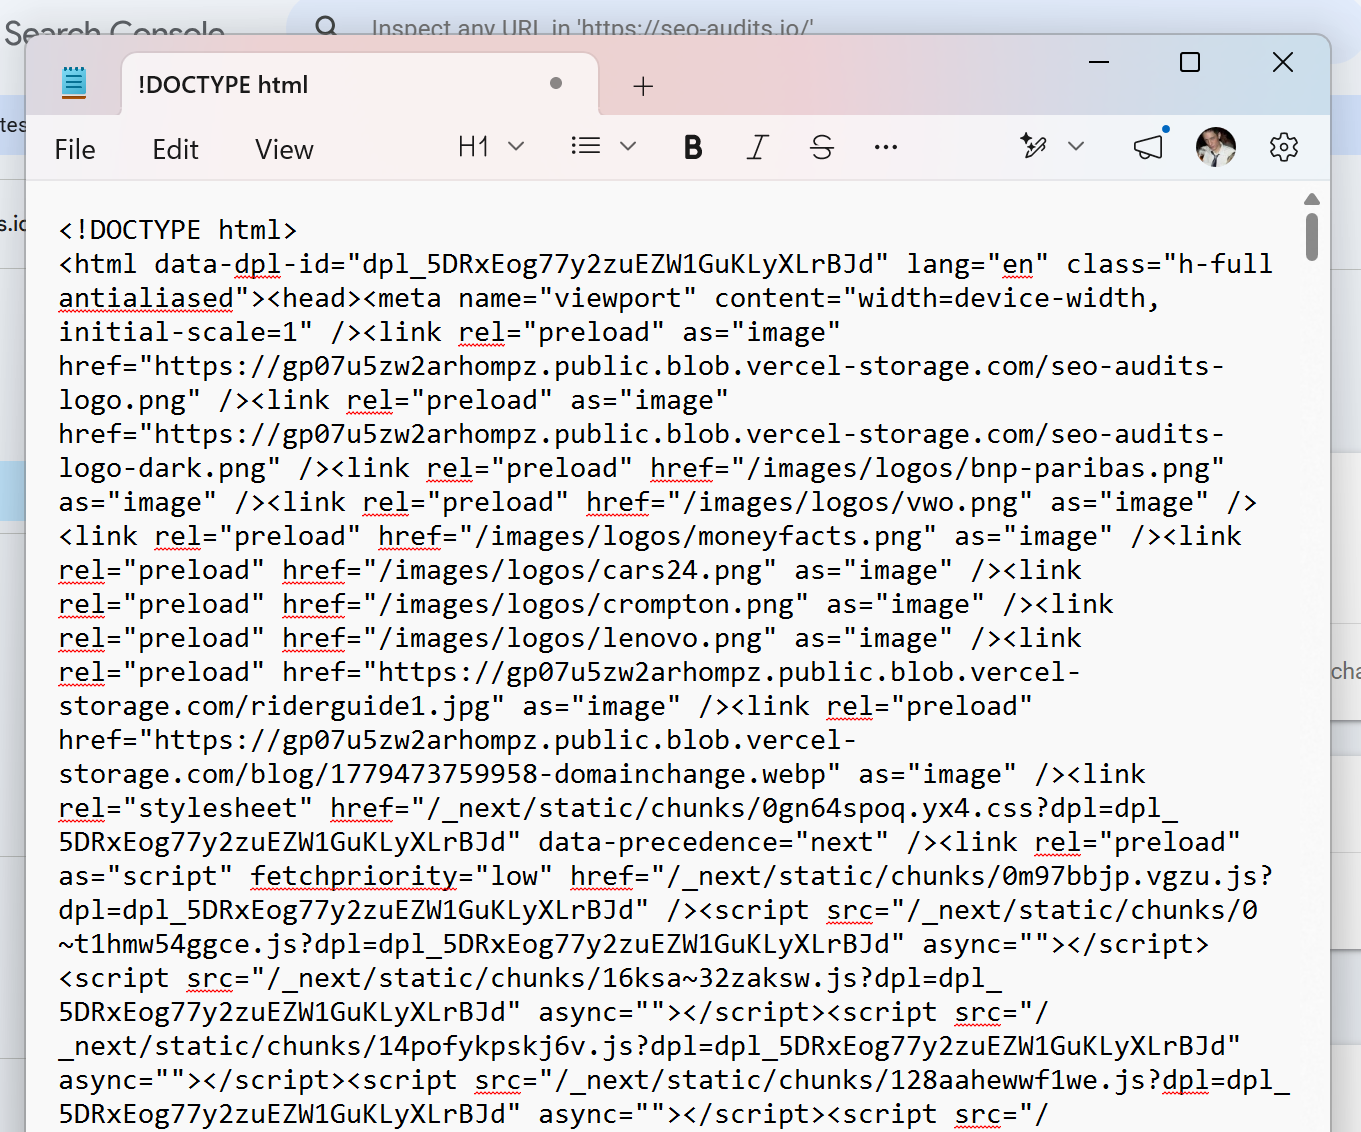
Then when I have saved the text file, I then go to the SAME URL I inspected in my browser, I then right click, inspect the URL and in the devtools I copy this html:
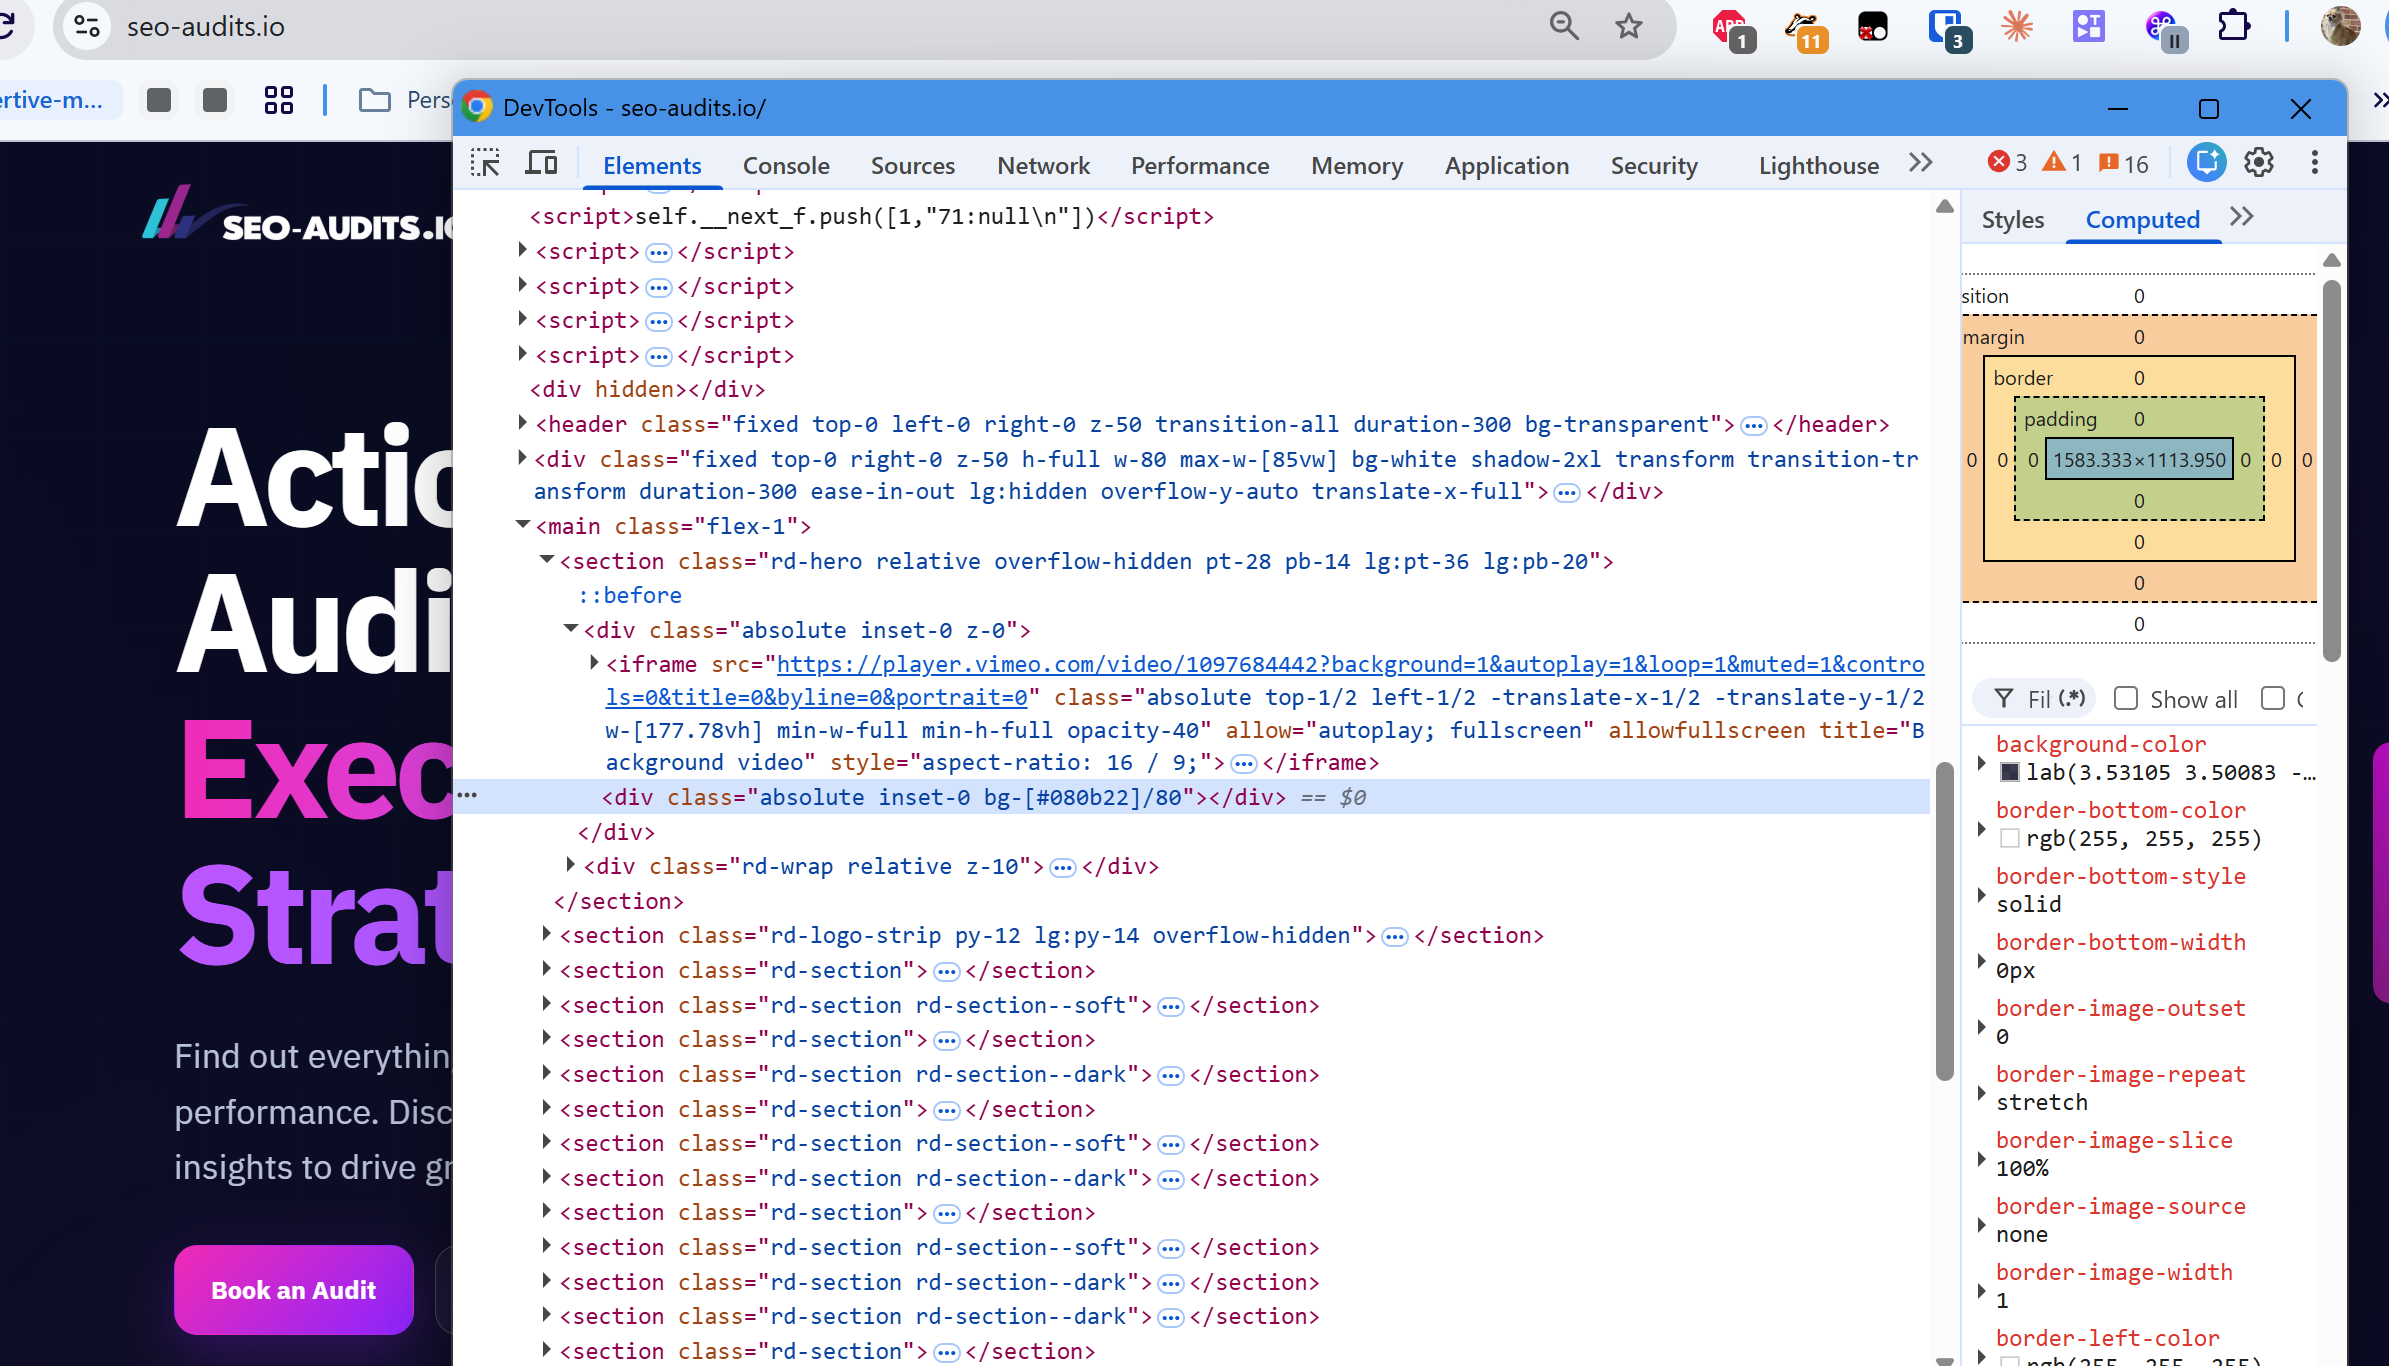
Simply right click at the top of the pages source and click edit as html, select all the code:
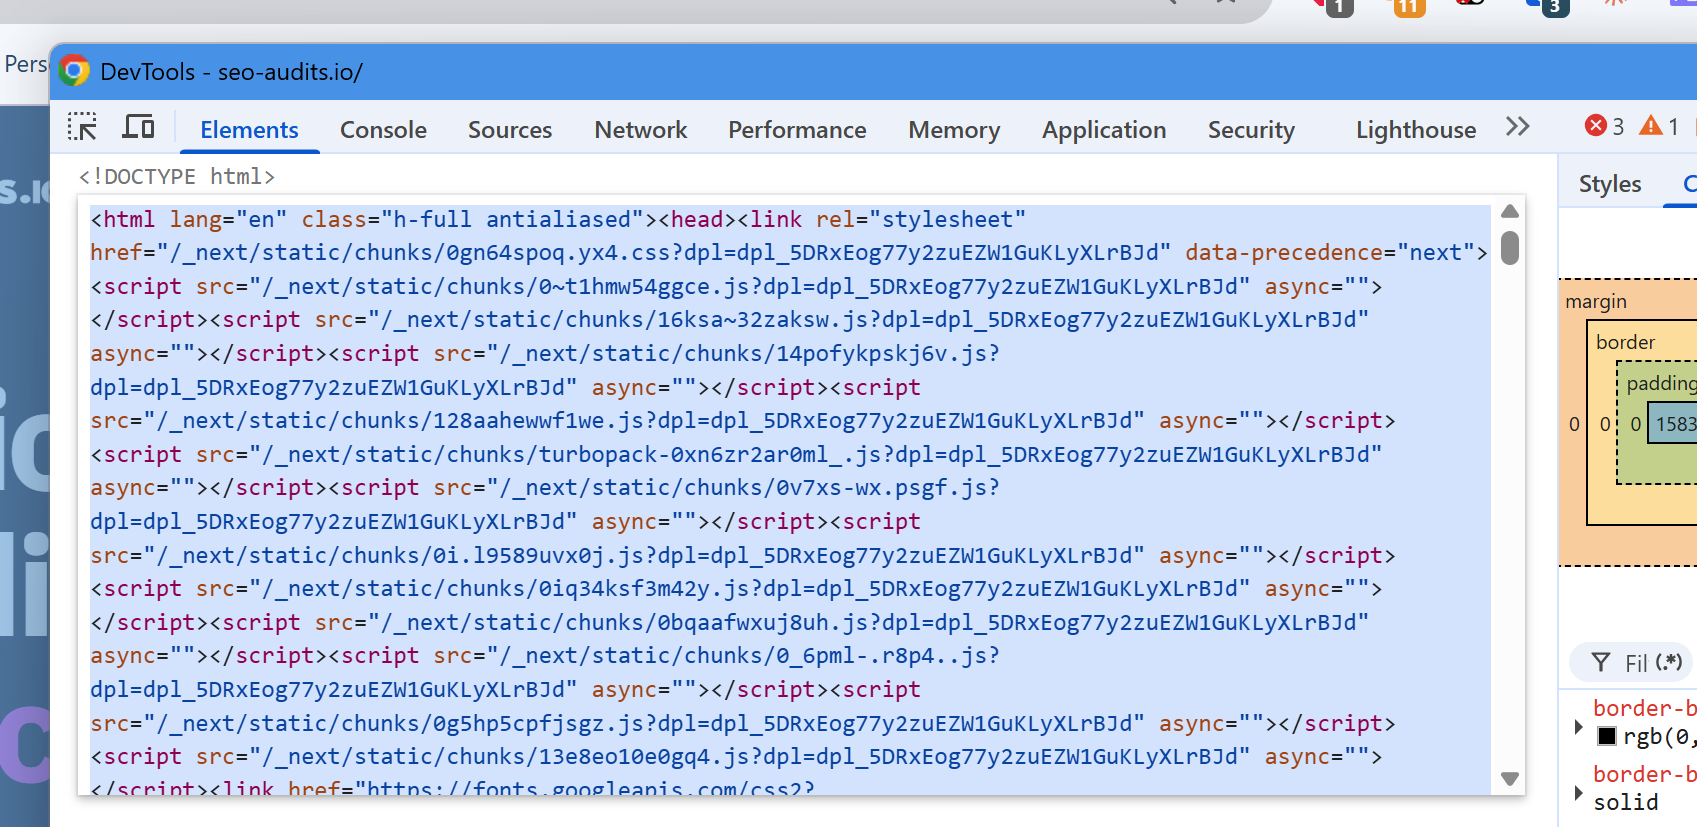
Then I copy and paste this into another NOTEPAD instance -
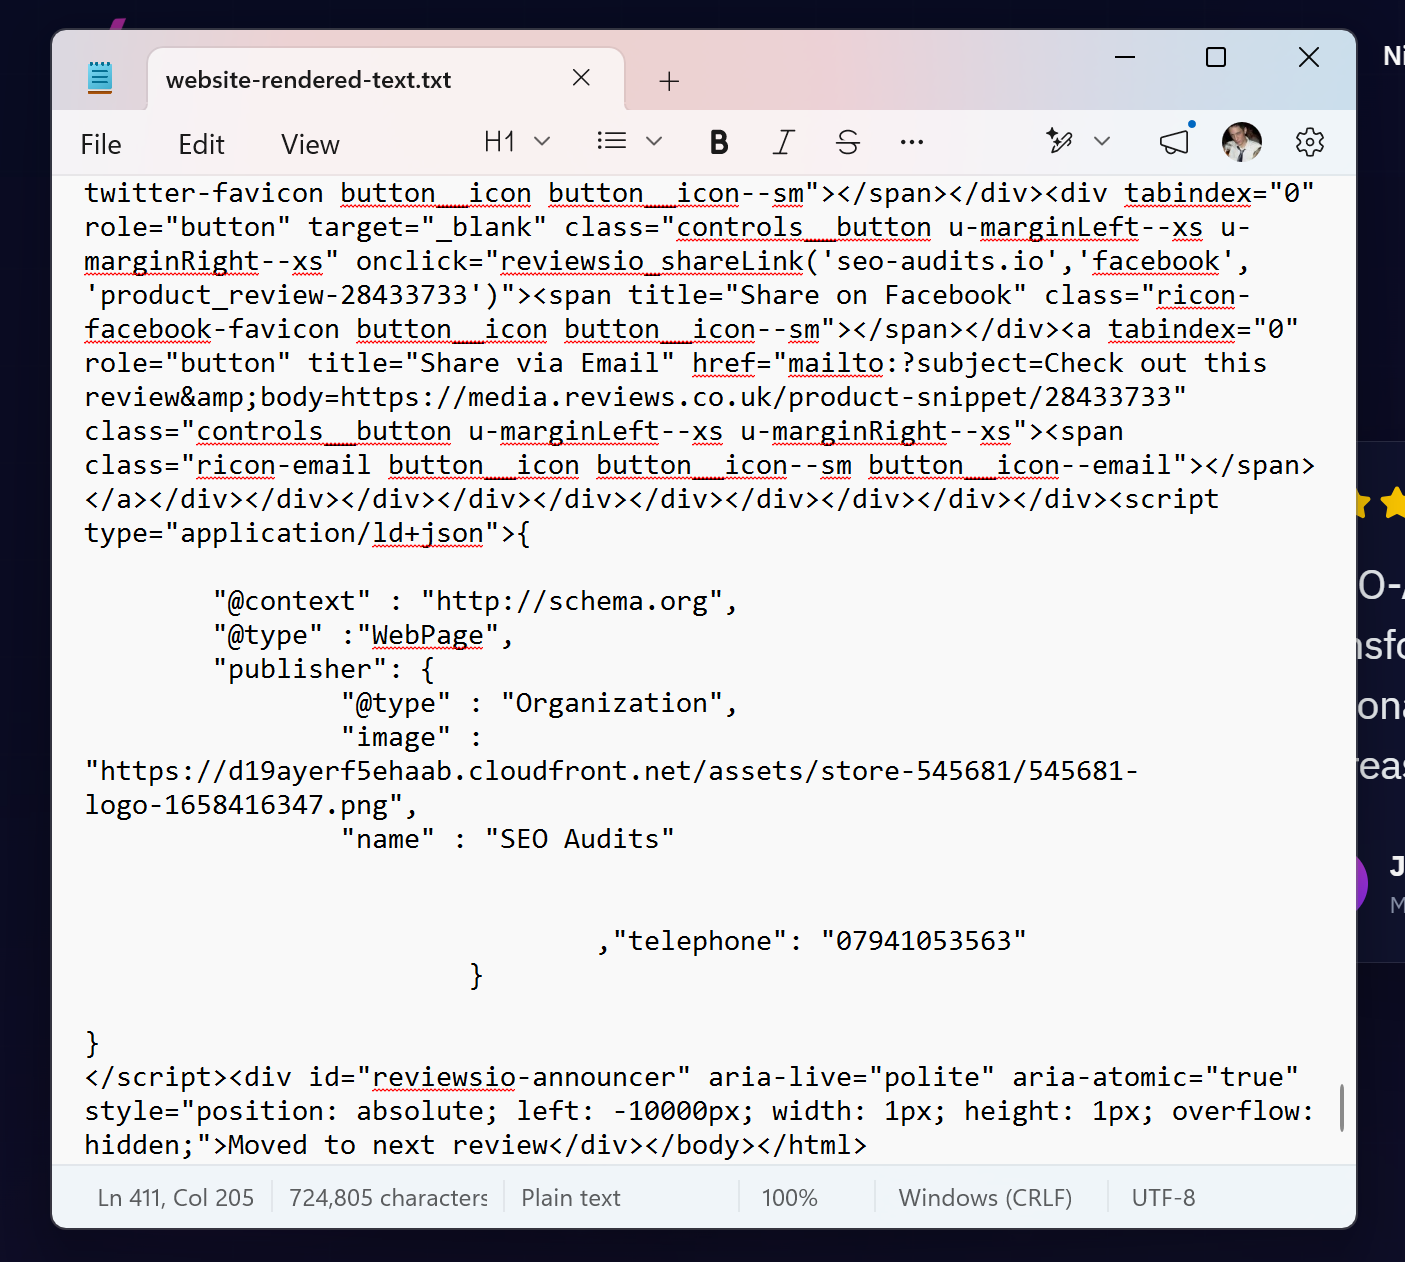
Then, with the 2 files I can to an AI of my choice i.e. Google Gemini and ask it to compare the documents:
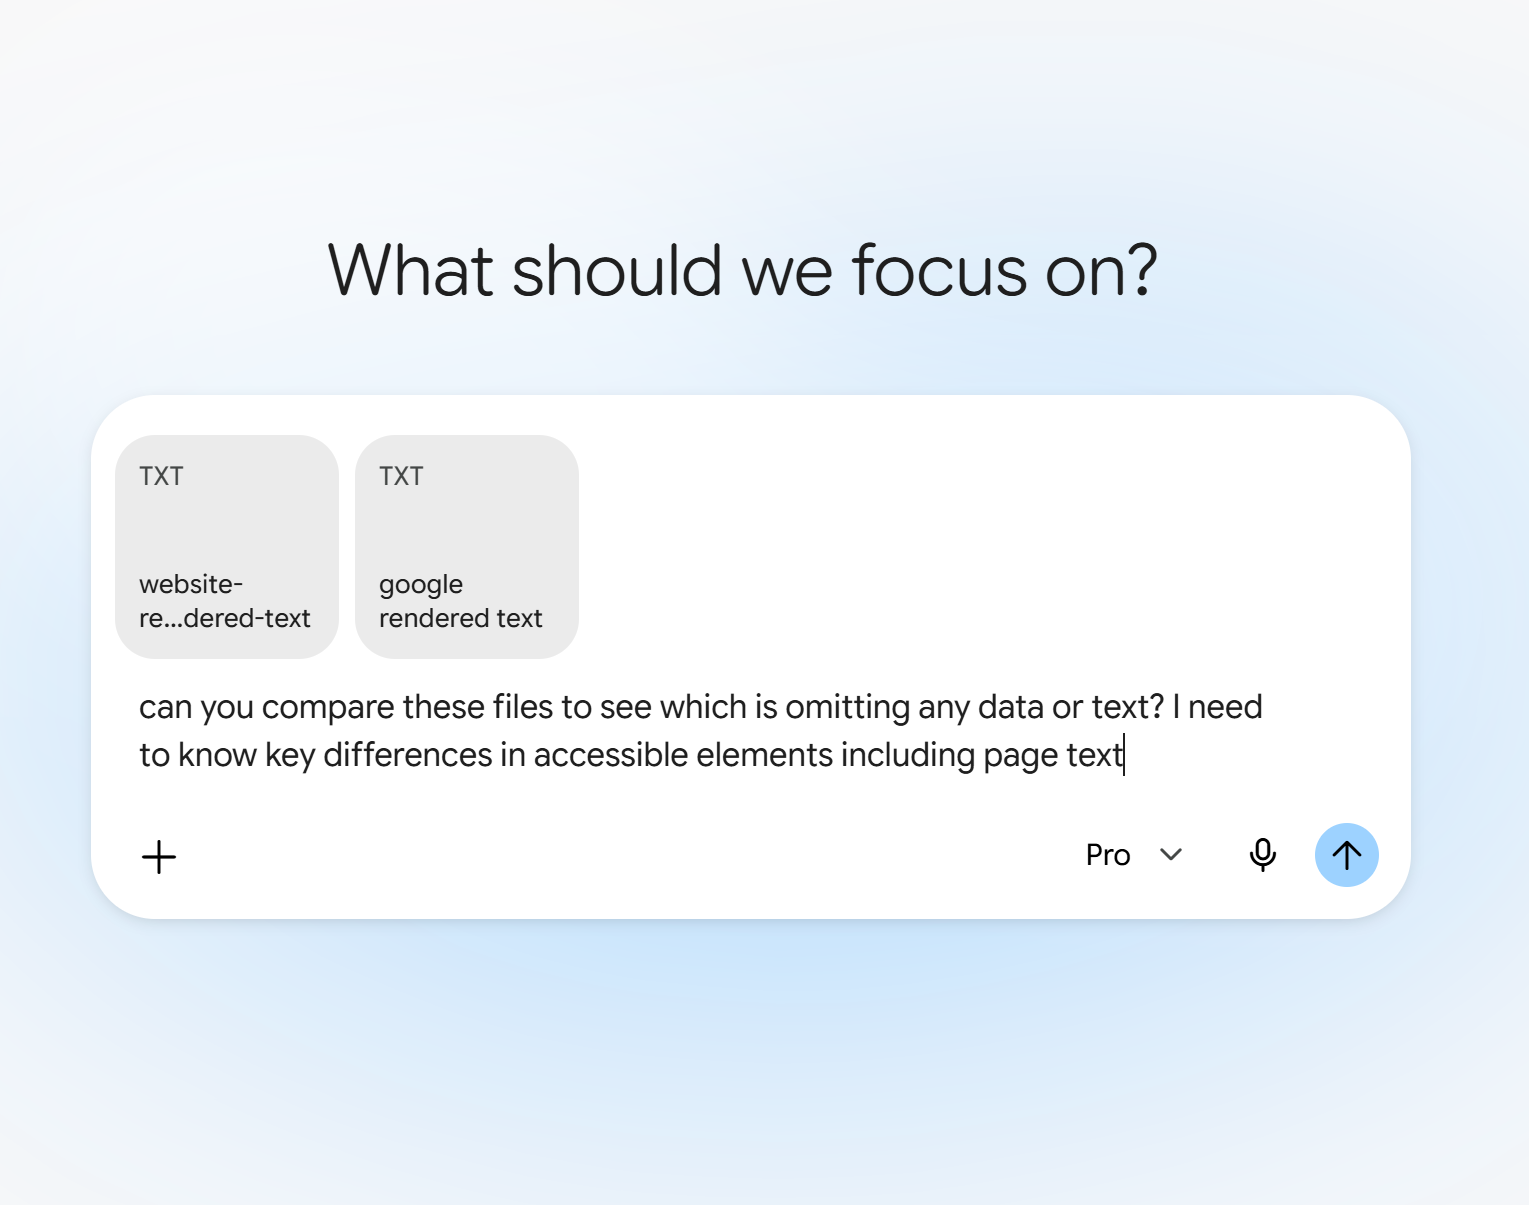
We can then get a written summary of the differences:
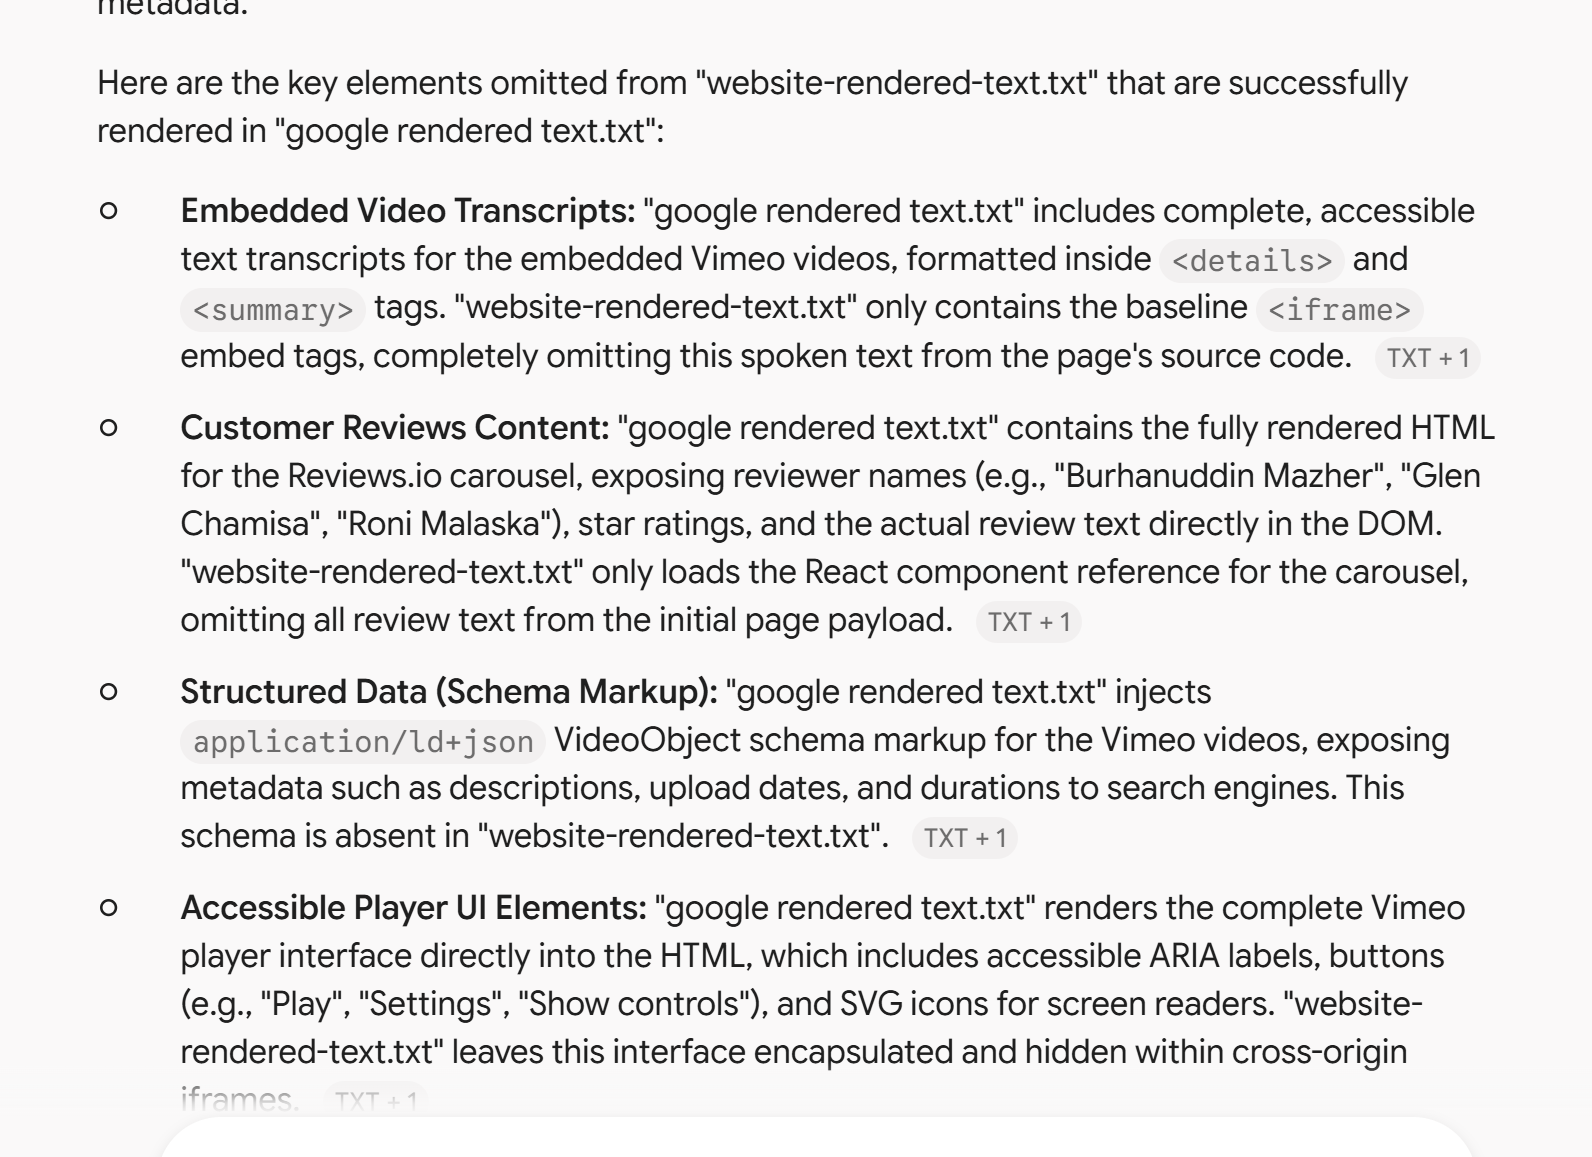
You can use this to get an idea of potential page elements that might not be accessible for user agents that do not render javascript - while Google can and does, it's not overly efficient at it, plus, a lot of LLMS do not render JS, so anything that's loaded dynamically is likely to be out of reach.
The other things you can do - you can visit your URL in your browser i.e. Google Chrome, hit F12 to open DEVTOOLS and then use the console.
Open DevTools and click CONSOLE >
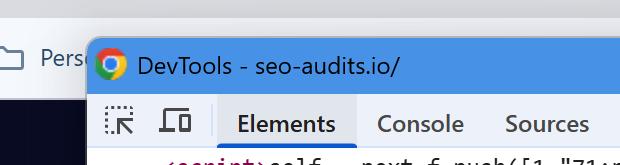
Then click the CLEAR CONSOLE icon (circle with line)
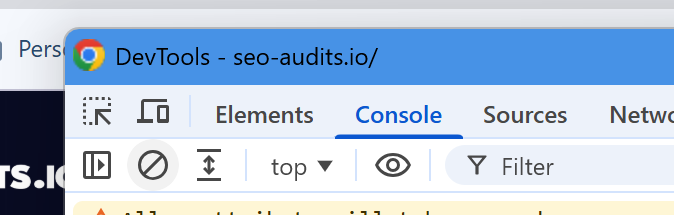
Then, in the console window, copy and paste the below in and hit ENTER:
(async () => {
  // Helper function to extract clean text, stripping out code elements
  const getCleanTextStats = (rootElement) => {
    if (!rootElement) return { chars: 0, words: 0 };
    const clone = rootElement.cloneNode(true);
    clone.querySelectorAll('script, style, noscript, svg, template').forEach(el => el.remove());
    const text = clone.textContent.replace(/\s+/g, ' ').trim();
    return {
      chars: text.length,
      words: text === "" ? 0 : text.split(' ').length
    };
  };

  try {
    // 1. Fetch the raw, unaltered HTML directly from the server
    console.log("Fetching original HTML...");
    const response = await fetch(window.location.href);
    const originalHtml = await response.text();
    const parser = new DOMParser();
    const originalDoc = parser.parseFromString(originalHtml, 'text/html');

    // 2. Analyze Original DOM (Server Response)
    const originalTextStats = getCleanTextStats(originalDoc.body);
    const originalLinksCount = originalDoc.querySelectorAll('a').length;

    // 3. Analyze Current DOM (JS-Rendered state)
    const currentTextStats = getCleanTextStats(document.body);
    const currentLinksCount = document.querySelectorAll('a').length;

    // 4. Output Results
    console.group('%cDOM Render Comparison', 'font-size: 16px; font-weight: bold; color: #4CAF50;');

    console.group('%cText Content (Excluding Scripts/Styles)', 'font-weight: bold;');
    console.log(`Original HTML:  ${originalTextStats.words} words (${originalTextStats.chars} chars)`);
    console.log(`Current DOM:    ${currentTextStats.words} words (${currentTextStats.chars} chars)`);
    console.log(`%cAdded by JS:    ${currentTextStats.words - originalTextStats.words} words`, 'color: #2196F3; font-weight:bold;');
    console.groupEnd();

    console.group('%cHyperlinks (<a> tags)', 'font-weight: bold;');
    console.log(`Original HTML:  ${originalLinksCount}`);
    console.log(`Current DOM:    ${currentLinksCount}`);
    console.log(`%cAdded by JS:    ${currentLinksCount - originalLinksCount}`, 'color: #2196F3; font-weight:bold;');
    console.groupEnd();

    console.groupEnd();
  } catch (error) {
    console.error('Error fetching original HTML. The site may block self-fetching via CORS or strict caching headers.', error);
  }
})();
This will then show you how much of your content is JS vs content that's in the original DOM
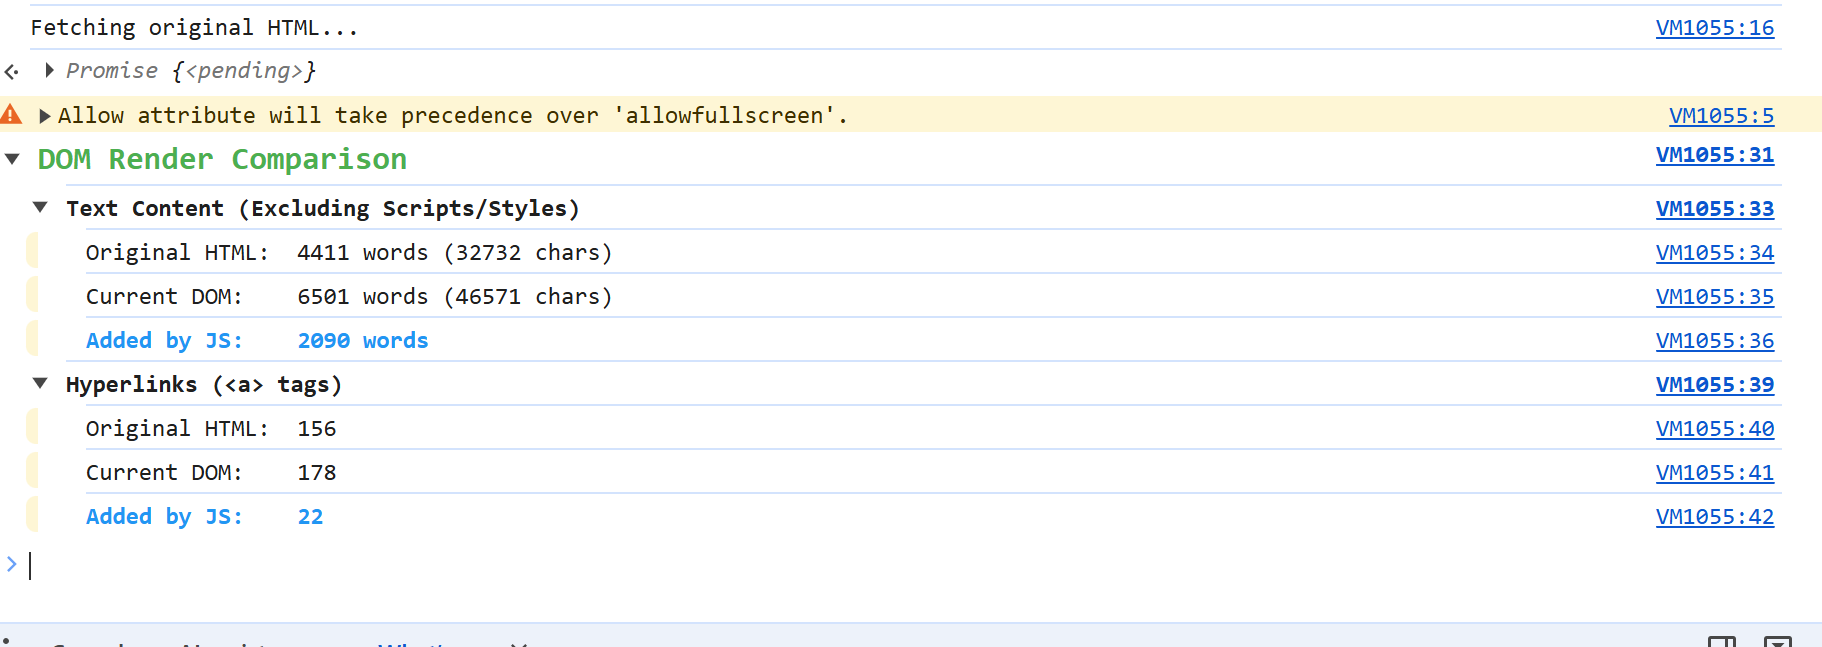
This will allow you to better understand what's in the ORIGINAL HTML vs the HTML with JAVASCRIPT.
Use the following code to see what text is dynamic via Javascript:
(async () => {
  try {
    console.log("Fetching original server HTML...");
    const response = await fetch(window.location.href);
    const originalHtml = await response.text();
    const parser = new DOMParser();
    const originalDoc = parser.parseFromString(originalHtml, 'text/html');

    // Helper function to extract clean text nodes, ignoring code blocks
    const extractTextNodes = (rootElement) => {
      const walker = document.createTreeWalker(
        rootElement,
        NodeFilter.SHOW_TEXT,
        {
          acceptNode: (node) => {
            const parentTag = node.parentNode.nodeName.toUpperCase();
            if (['SCRIPT', 'STYLE', 'NOSCRIPT', 'TEMPLATE', 'SVG'].includes(parentTag)) {
              return NodeFilter.FILTER_REJECT;
            }
            // Only accept nodes that have visible text
            return node.nodeValue.trim() !== '' ? NodeFilter.FILTER_ACCEPT : NodeFilter.FILTER_SKIP;
          }
        }
      );

      const texts = [];
      let currentNode;
      while ((currentNode = walker.nextNode())) {
        // Normalize whitespace and push to array
        texts.push(currentNode.nodeValue.replace(/\s+/g, ' ').trim());
      }
      return texts;
    };

    // 1. Gather all text nodes from both DOMs
    const originalTexts = extractTextNodes(originalDoc.body);
    const currentTexts = extractTextNodes(document.body);

    // 2. Identify text strings present in the current DOM but missing from the original
    const originalTextSet = new Set(originalTexts);
    const jsRenderedTexts = currentTexts.filter(text => !originalTextSet.has(text));

    // 3. Output Results
    console.group('%cJavaScript-Injected Text Strings', 'font-size: 16px; font-weight: bold; color: #9C27B0;');

    if (jsRenderedTexts.length === 0) {
      console.log('%cNo new text fragments were injected by JavaScript.', 'font-weight: bold; color: #4CAF50;');
    } else {
      console.log(`%cFound ${jsRenderedTexts.length} distinct text nodes added by JS:`, 'font-weight: bold; margin-bottom: 8px;');

      jsRenderedTexts.forEach((text, index) => {
        console.log(`%c[${index + 1}] %c${text}`, 'color: #999; font-weight: bold;', 'color: #333;');
      });
    }

    console.groupEnd();

  } catch (error) {
    console.error('Error fetching original HTML. The site may have strict cross-origin or caching policies blocking the fetch request.', error);
  }
})();
This will then give you an overview of all the JAVASCRIPT text strings - which is content unlikely to be picked up by most NON JS crawlers or those that do not render -
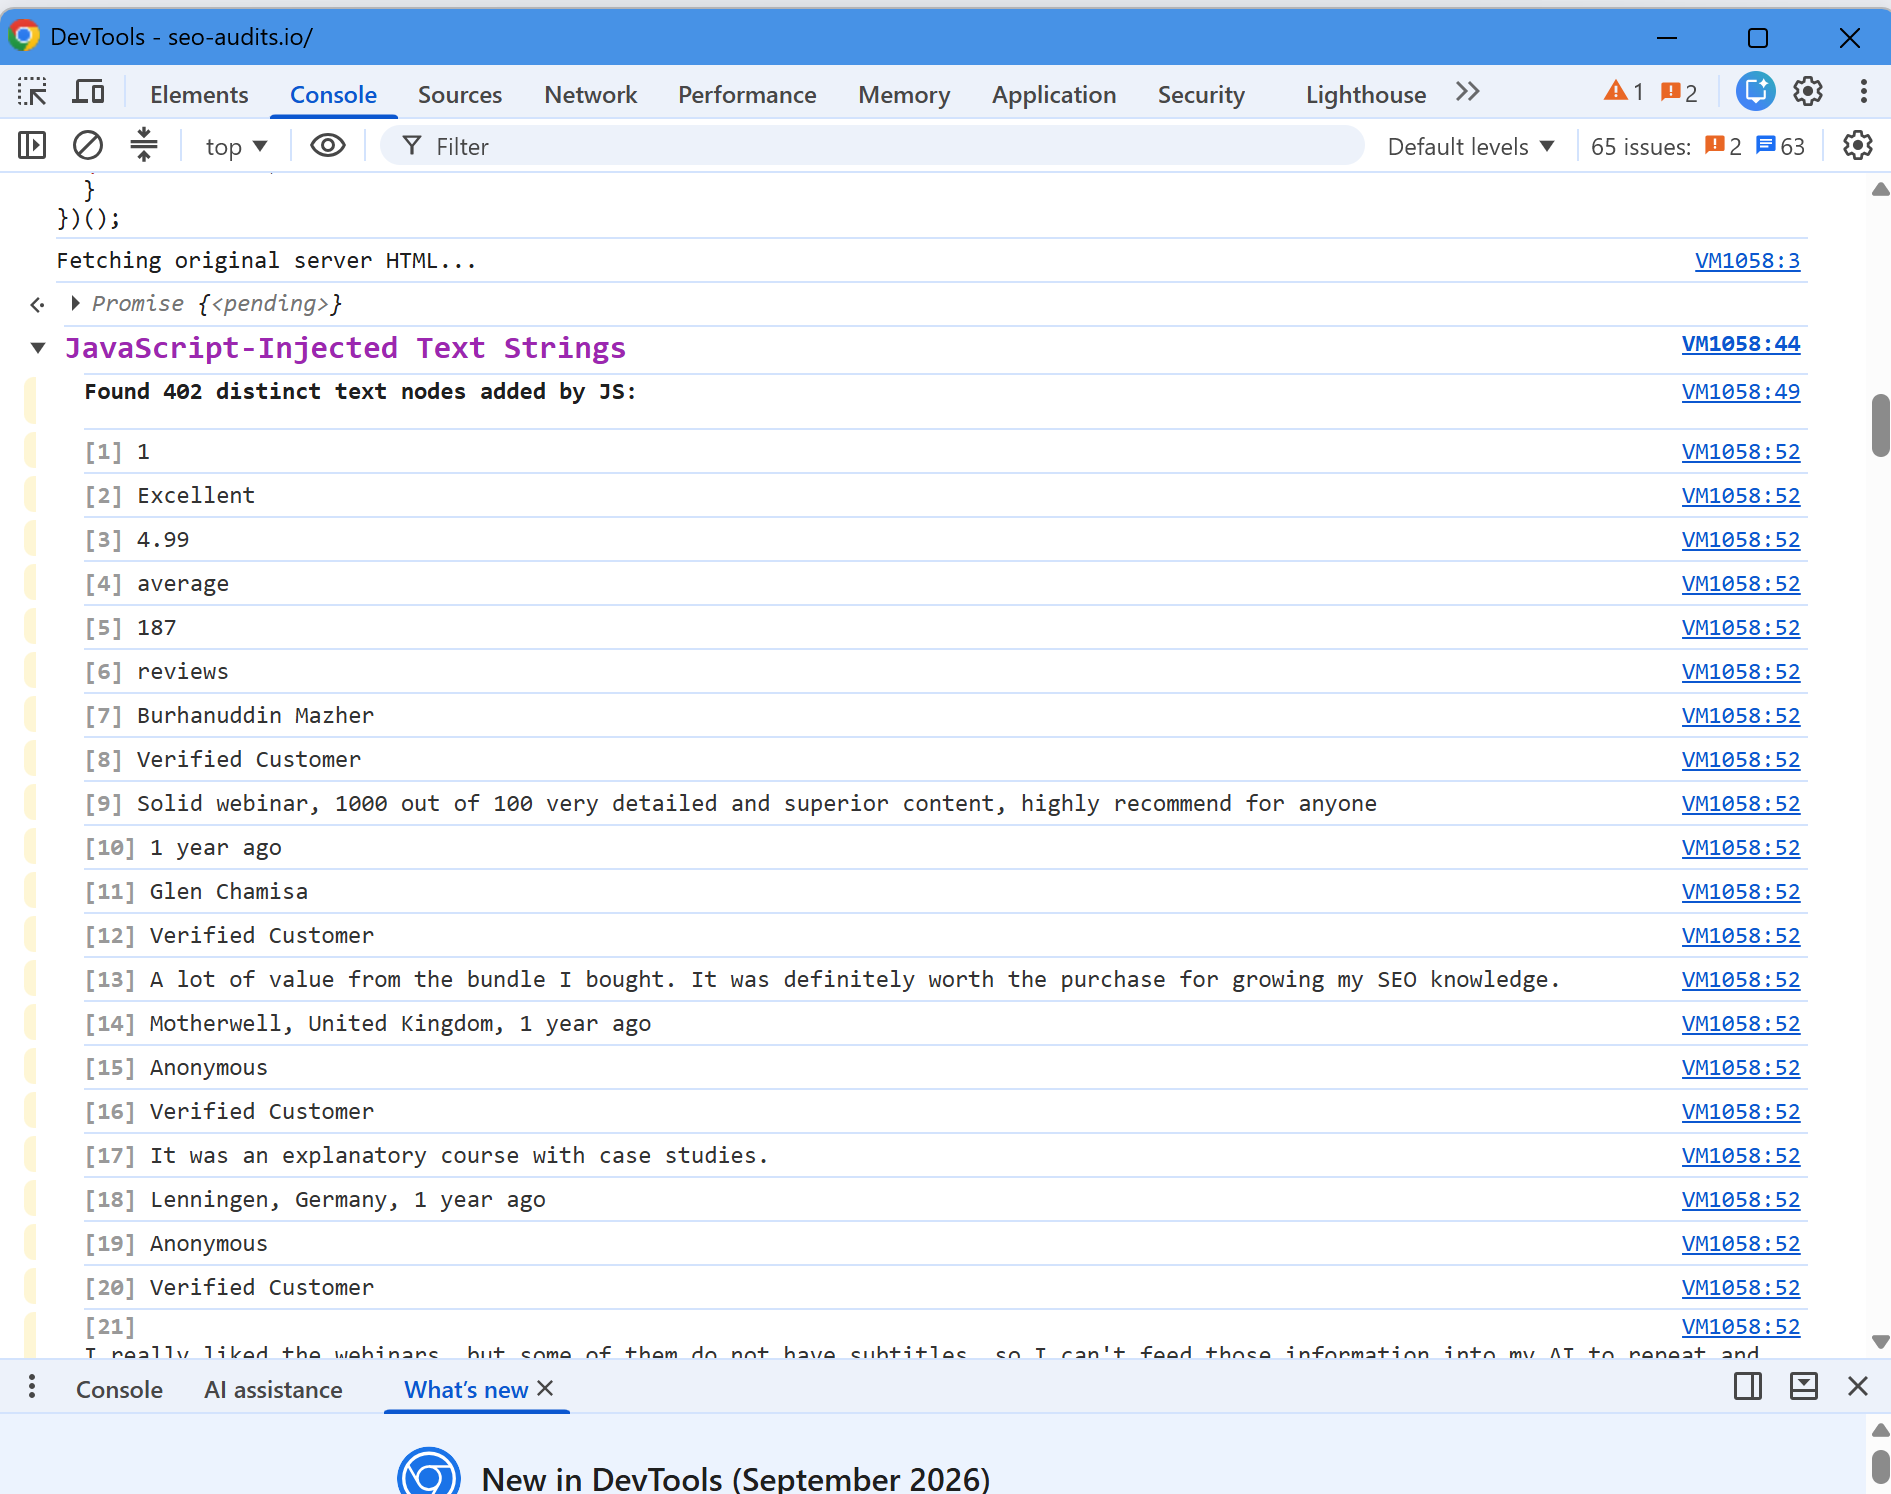
This will help you see what is JAVASCRIPT content and what is not.
Anyback, back to GSC:
In Screenshot, check what the Google Inspection Tool smartphone renderer displays. Treat this as a visual check, not a complete transcript of the page. A missing item in the screenshot should be checked in the HTML tab before you conclude it is absent.

In More Info, review the JavaScript console output, HTTP headers and resources. A failed script, blocked API response or missing resource can explain why a client-rendered section did not appear.
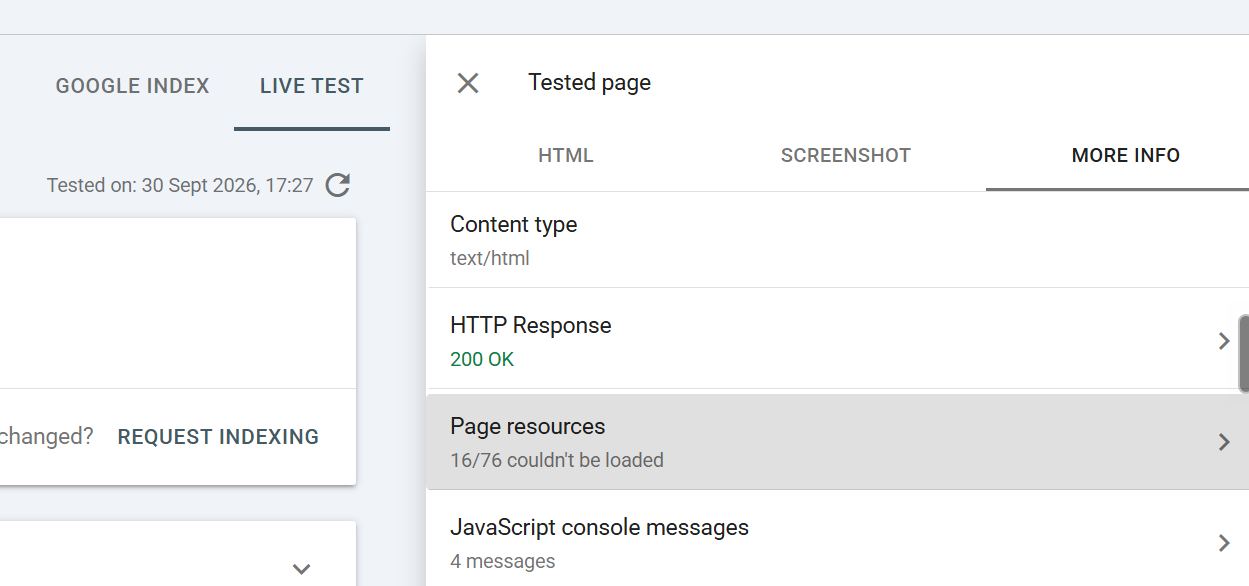
Compare the live test with the Google Index view. The live test fetches the current page; it is not the stored indexed version and a positive result does not guarantee that Google will index the URL.
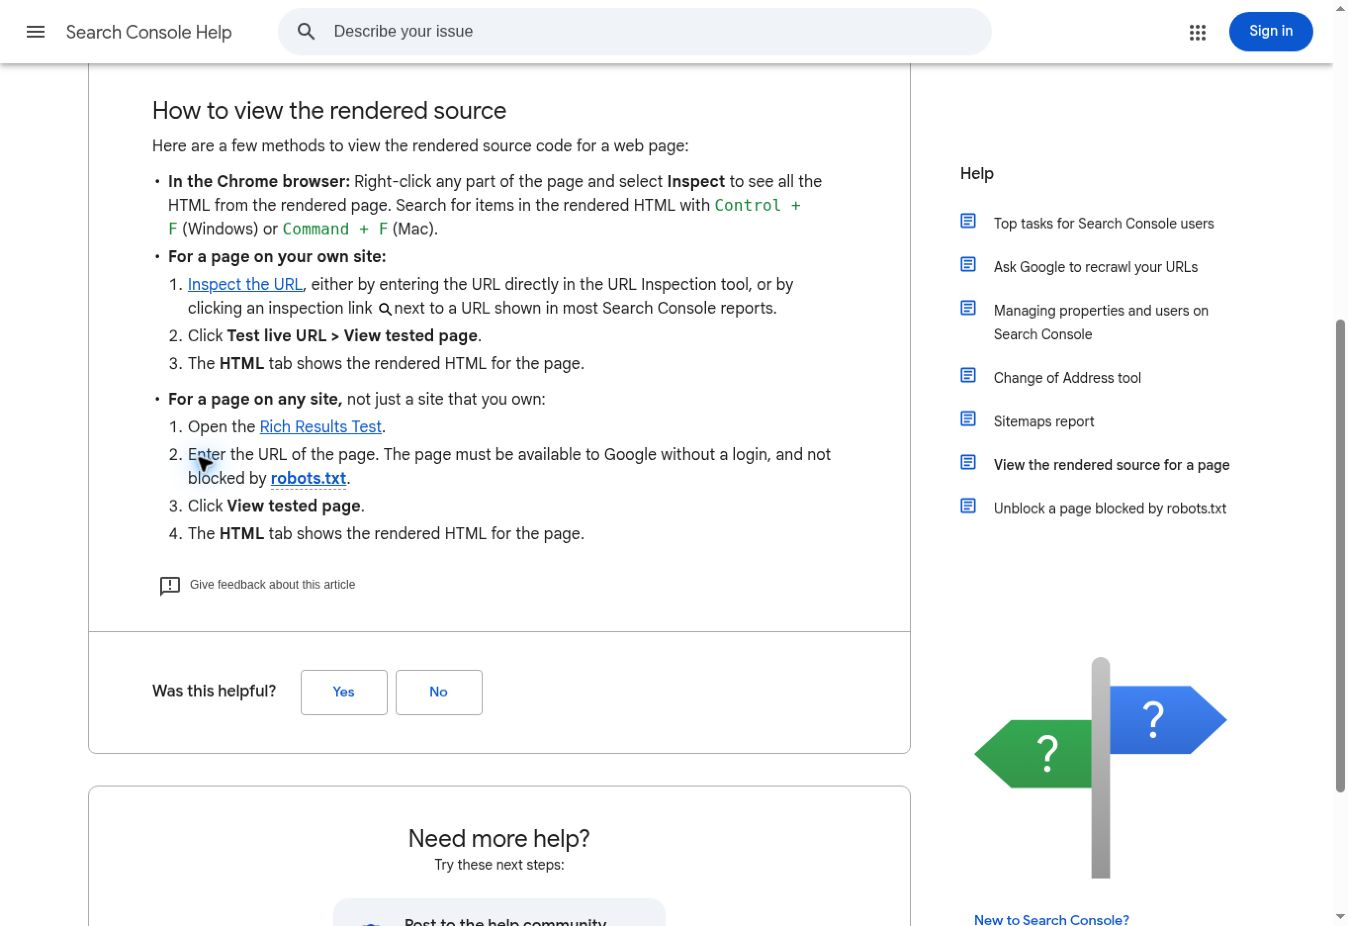
Figure 2. Google’s Search Console Help page documents the property workflow: inspect the URL, run Test live URL, open View tested page, then use the HTML tab. The screenshot is the help page, not a property-specific inspection report
The URL Inspection live test is useful because Google also exposes the rendered screenshot, response headers, JavaScript output and loaded resources. The screenshot is available only when the live test can fetch the page successfully. Use the rendered HTML to verify whether important text and links are present, then use More Info to investigate failures.
Use the public Rich Results Test for an outside page
Search Console URL Inspection requires the URL to sit inside a property you control. Google’s rendered source help recommends the Rich Results Test for public pages you do not own. Its HTML tab also shows rendered HTML, provided the page is publicly accessible and not blocked to Google. Use it as a way to inspect Google’s render, not as an indexing verdict: the tool’s primary report checks supported structured data.
I ran that public test on the W3Schools AJAX example. Google’s smartphone screenshot still shows the placeholder and the unclicked button. Searching the rendered HTML finds the same placeholder. The browser view after a human clicks the button shows the fetched text instead. This is direct evidence that the user interaction changes what the page displays; it is not evidence that Google failed to render JavaScript generally.
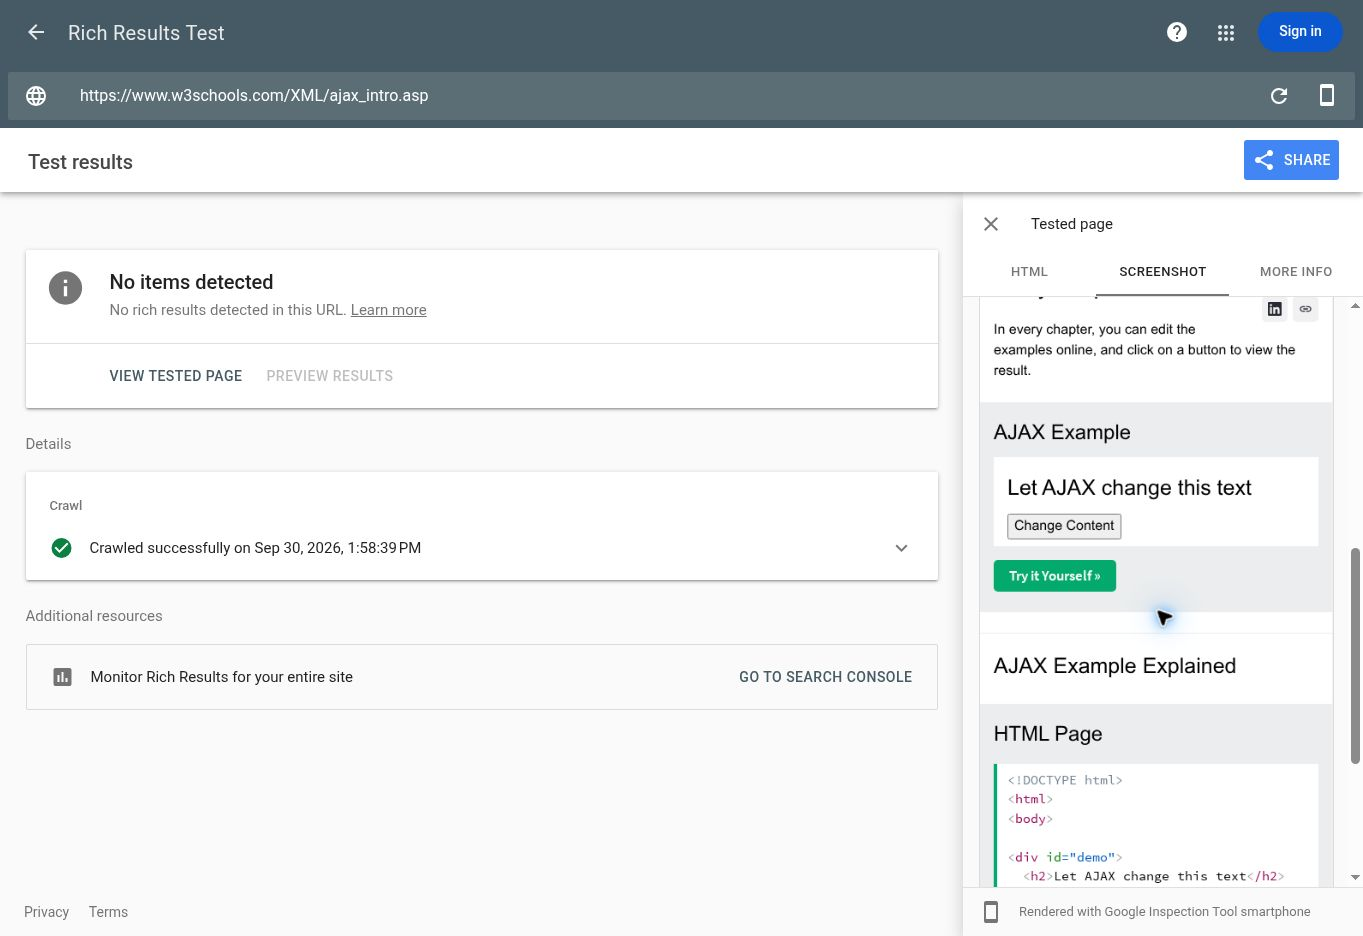
Figure 3. Google Inspection Tool smartphone render of the public AJAX example. The placeholder and Change Content button remain visible because the test does not click the control.
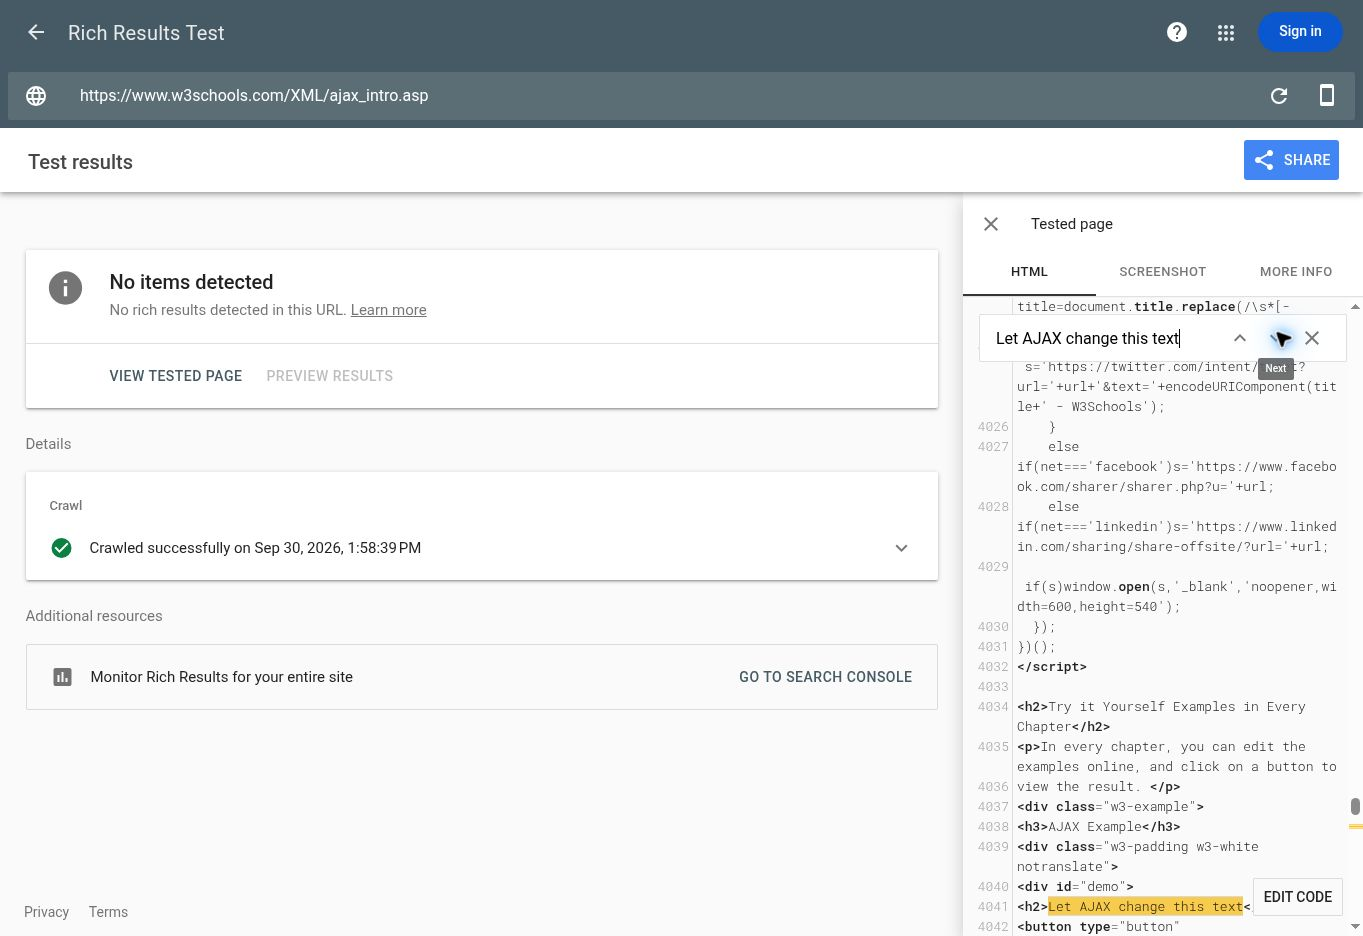
Figure 4. The public test’s HTML panel finds the initial placeholder and button in Google’s rendered HTML. The result also says “No items detected”; that refers to structured data, not overall indexability.
Google’s live test is a current diagnostic fetch. It does not determine canonical selection or whether a page will appear in search, and it can differ from the indexed version. After a fix, test the live URL again, then revisit the Google Index view after Google recrawls the page.
Read the differences
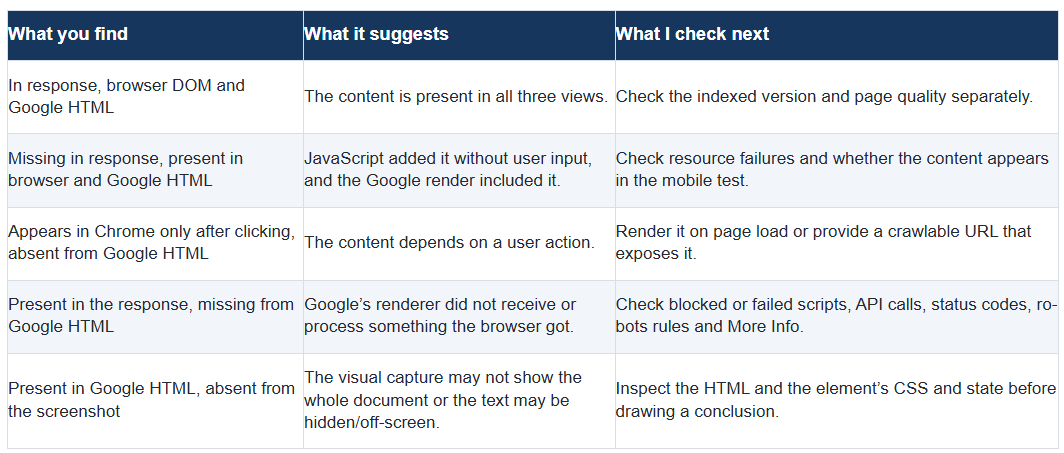
For navigation, look for links with meaningful href values in the initial or rendered HTML. Google can process JavaScript-injected links when they follow crawlable link practices, but it does not normally click a “Load more” button to discover the next batch. For paginated content, expose separate URLs and link to them.
Fix the delivery path
If a heading, key paragraph, product specification or indexable link only appears after a click, move it into the initial HTML or make it load automatically without a user action. Server-side rendering or pre-rendering is often the simplest way to make critical copy available early, although Google can process client-rendered content when its scripts and data load correctly. [3]
Use buttons for actions. Use anchor links with href values for navigation and pagination.
Keep the page’s key copy, title, canonical, robots directives and structured data available in the rendered page without a click.
Load content because the page is requested or an element enters the viewport, not only after a user presses a control.
Check the mobile render, console output and required resources. Google’s live screenshot uses the Google Inspection Tool user agent, which can reveal a mobile-specific difference.
After a code change, rerun the live URL test. Check the indexed view later to confirm what Google stored after recrawling.
My final check
Before I close a JavaScript rendering issue, I confirm that the main heading and key copy appear in Google’s rendered HTML; navigation and pagination expose crawlable URLs; the page does not need a click to reveal its search-relevant content; and the live test has no failed resources or JavaScript errors that explain a gap. I then compare the live test with the indexed version so I do not mistake a current render for what Google has already stored.